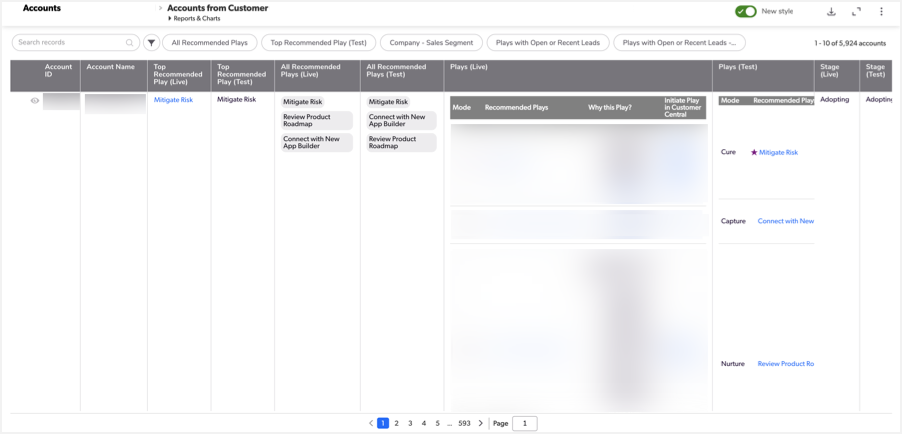
Using the new style table report
New style table reports, which have been optionally available since Summer 2020, are becoming the default table report style during Spring 2021.
If new style table reports are your default setting, you can switch individual reports back and forth between the legacy and new style using the New style switch near the top right of the report.

We encourage you to transition to the new style, since we eventually plan to retire the toggle and the legacy table report style.
The new table report is designed to feel familiar to existing Quickbase users, but offers simpler workflows and a cleaner look, and opens the way for future improvements. Most tasks are identical to what you’re used to in the legacy table report. This article describes the navigation styles and workflows that have changed slightly.
Benefits and changes to the new table report style include:
- Better look and feel with full-screen mode and resizable columns
- Pale and full color-coding options
- Nested record grouping
- Pages that are easier to navigate
- More prominent download button
Creating a table report
Create a table report the same way you’re used to. When you’re done, you’ll see it in the new style by default. You can switch the style back and forth using the switch.
- Click Reports & Charts to expand the Reports and Charts panel.
- Click + New. The New report or chart dialog opens.
- Select Table and click Create. The Create a New Report page opens.
- Select from the configuration options. When you’re done, click Display to see a preview or Save to finish.
Adjusting the display of your table report
The new table report style offers flexible display options that help you maximize space.
Open your report to full screen mode by clicking the full screen icon ![]() .
.
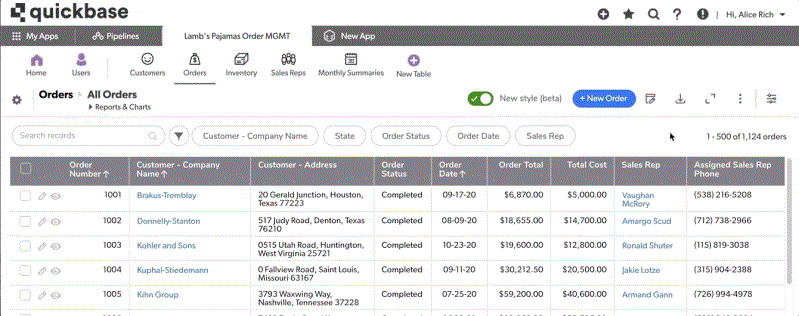
Adjust column widths for yourself by hovering over any column border and then click and drag to resize columns in any report. Quickbase remembers column sizes for each user. This means that when you resize a column, your adjustment persists when you close and reopen Quickbase, but has no effect on any other user of the new table report.
All columns have a default size based on their title and content. No one, including builders, can set column widths for any other report user.

For additional spacing options, open the![]() menu and choose from relaxed, normal, or condensed spacing.
menu and choose from relaxed, normal, or condensed spacing.
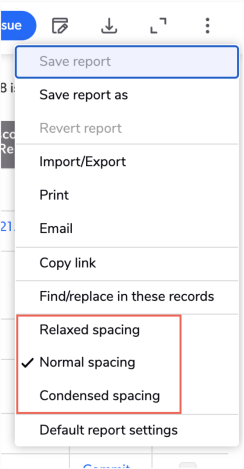
If you use this menu to select a spacing option that is different from your Quickbase UI Spacing default setting, your selection will always appear in that specific report, but won’t apply to any other reports.
The default appearance of color-coding in new table report style is pale, but you can switch it to a more noticeable full-color version.
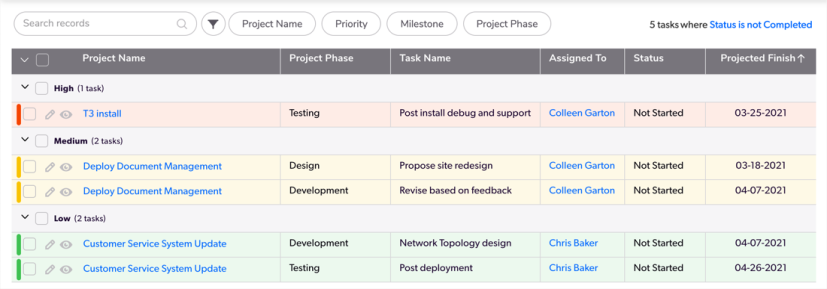
Pale colors
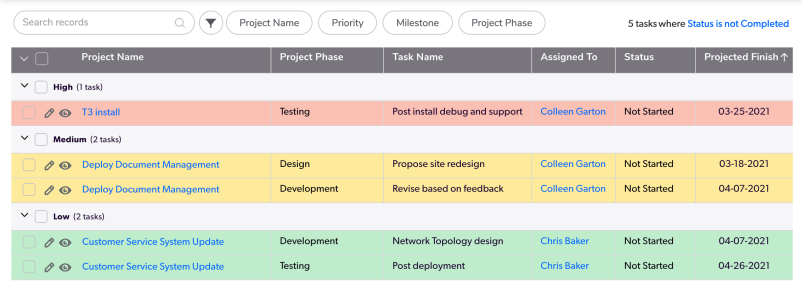
Full colors
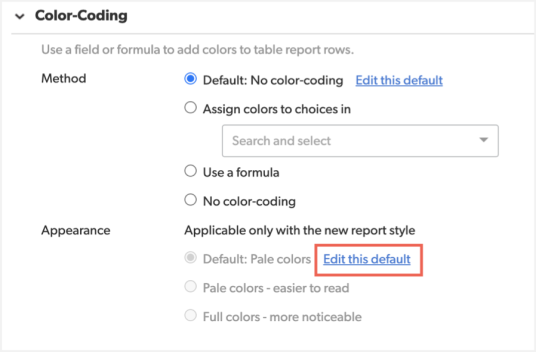
To switch the default appearance for new style reports and reports that don’t have individual settings, open the report builder, select Edit this default in the Color-Coding section, and select your preferred setting.
Navigating the new table report style
Switch between pages in the new table report style by selecting the arrows and numbers at the bottom of the page with your mouse or keyboard.
You can also type a page’s number to go directly to that page, or move one page at a time by clicking in the box and pressing Shift + arrow key.

Downloading a new table report’s records
Download all the records in a report as a CSV file by clicking the Download report as a CSV ![]() icon.
icon.

The new table report style downloads as a CSV and includes all the records your table report contained in Quickbase, with all the fields shown in the report.
Showing columns
Select Show columns from the column menu to display additional columns on a report. This feature was called “Add a column” in the legacy report style, and is located in the same place.
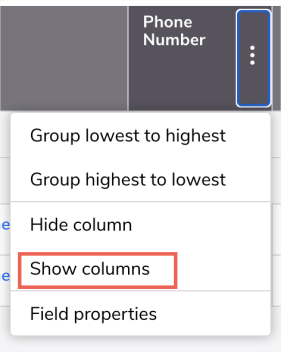
Click the right corner of the column header to find Show columns. When you click Show columns, a window appears where you can search for fields or select them from a menu. When you’re done, click Apply.
If your permissions let you customize the report, access the column menu by clicking on the right side of any column header.
Using dynamic and column filters
In the legacy table report style, builders select dynamic filters to appear on the left of the page. Dynamic filters are still easy to access and are always visible at the top of your report. To apply a filter, click it and select from its list, type into its text box, or use its date pop-up.

The process for builders to add dynamic filters to a report hasn’t changed.
All columns that are used as dynamic filters load when you open the report. Get filter information for all other columns by selecting the funnel icon ![]() next to the search bar and clicking the column header. Then, the filter information loads.
next to the search bar and clicking the column header. Then, the filter information loads.

Filter and sort columns by selecting the funnel icon ![]() and then clicking the column header. Sort columns by clicking on the column header.
and then clicking the column header. Sort columns by clicking on the column header.
When a filter has a text box, you can enter a partial term like Carolina. You can also use AND and OR, like Carolina AND south or Carolina OR Dakota. When a filter has a choice list, you can search and select exact terms, like North Carolina.
Column filter options
Column filtering isn’t available for these types of columns in the new table report style:
- Report Formula
- Report Link
- Duration / Formula - Duration
- File Attachment
- iCal (in retirement)
- vCard (in retirement)
Grouping rows
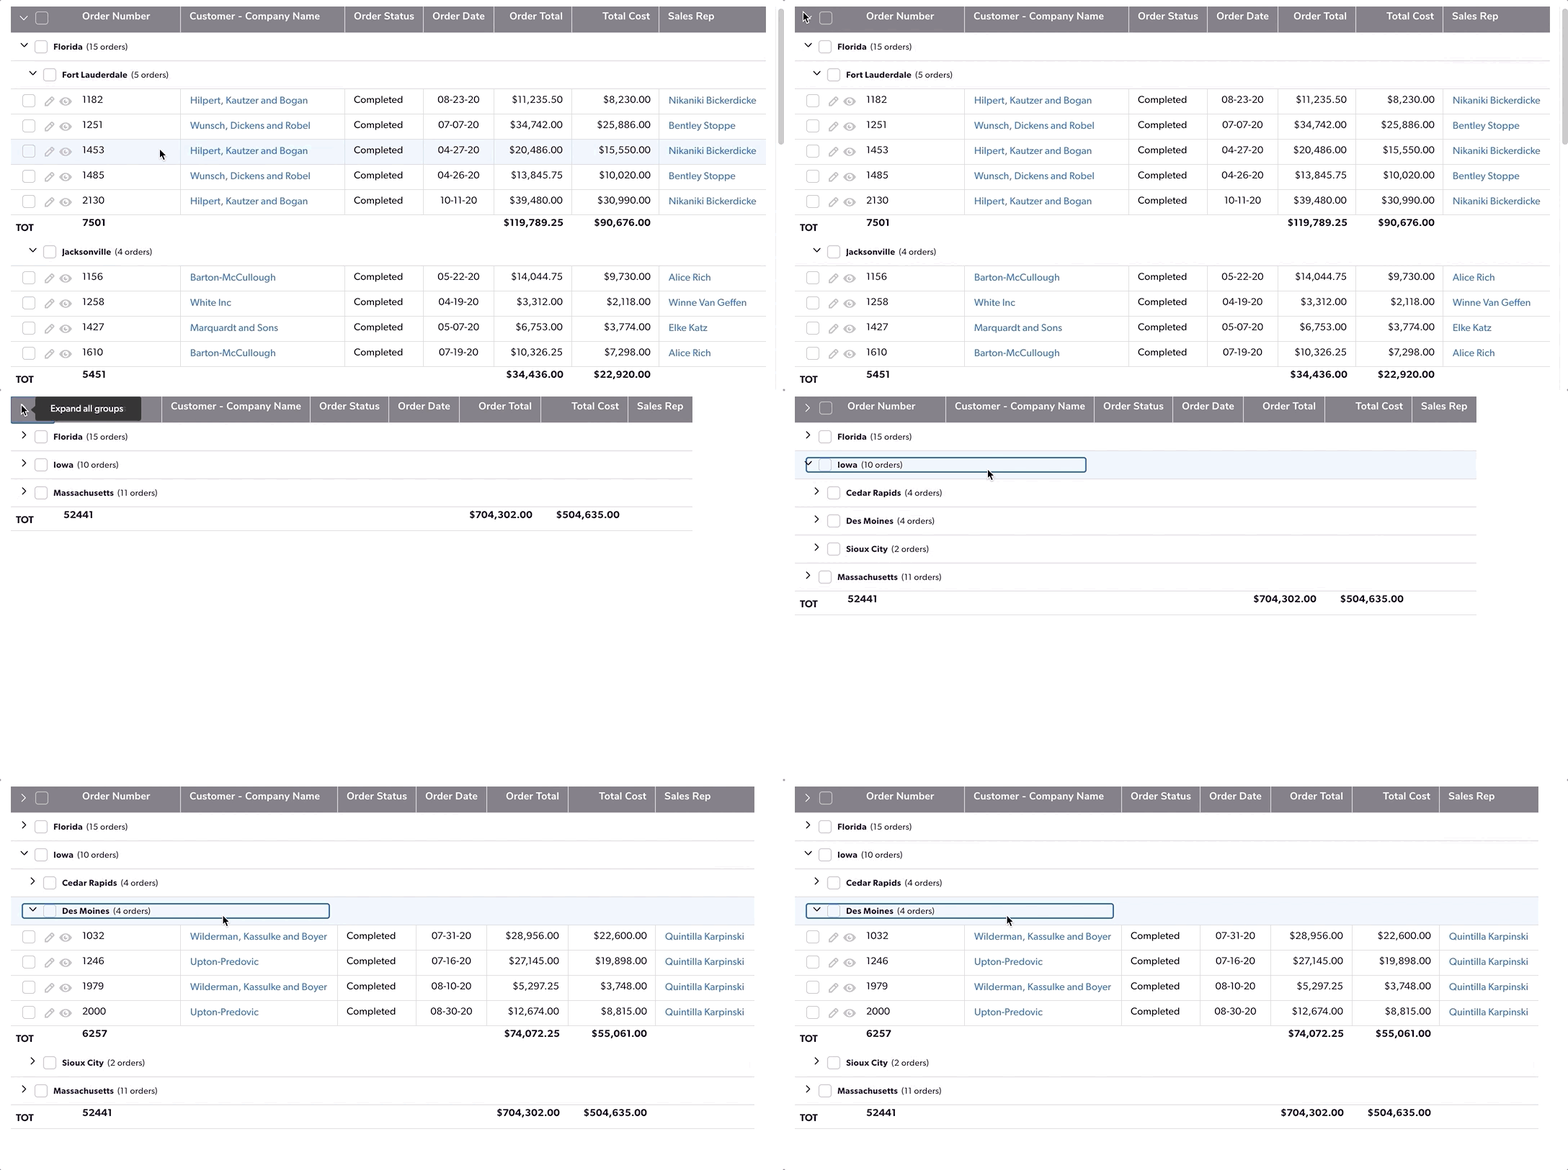
Builders group rows in the same way, but now, if you group your report on multiple fields, each group is nested within the group above it. You can collapse and expand groups based on what information you need to see, making reports easier to scan. This change maximizes space and creates a clearer hierarchy in reports.
