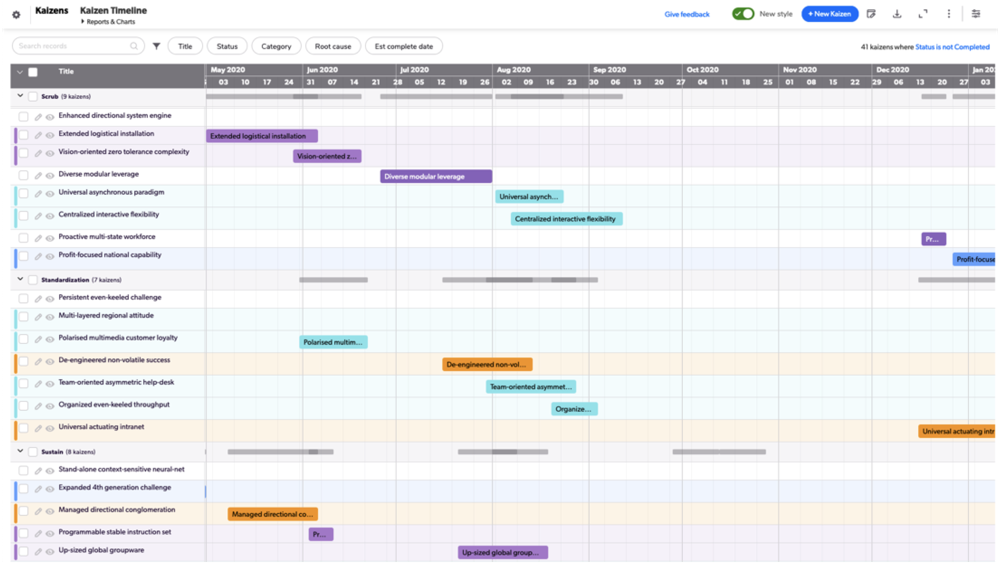
A timeline is way to represent data, or Quickbase records, in relation to time. You can create a timeline report for any records that have a start date and end date, like a task or project.
Quickbase recently redesigned timeline reports, introducing new features like resizable columns, column filters, and row colorization. Beginning in October 2021, all timeline reports in Quickbase default to the new style on dashboards, and report and table home pages, but you can toggle between the new and old style at the top of a report.

Each bar on a timeline represents the duration of an event. You tell Quickbase which fields represent the start and finish, what time period you want to view, and what records should appear when you design the timeline. You can also include additional fields on the left side of the timeline to better describe an event.
Grouping and collapsing timelines
Quickbase timelines let you gather records into groups. For example, you may want to group tasks by Planning Phase or Related Project. If you want, you can group on multiple levels, nesting additional groups beneath the top-level group. When you group records within a timeline, Quickbase displays a gray line that visually spans the time covered by all events in the group. When many records in a group occur during the same time period, the report displays a darker shade of gray. Viewers can collapse timeline groups to get the big picture.
When you collapse a timeline, viewers can focus on and compare durations across the highest level group. To collapse and expand the entire timeline, click the arrow in the top left corner. You can also collapse individual groups. To do so, click the arrow to the left of the group you want to collapse.
Learn how to create a timeline report.