So you're comparing portions! After all, that's what a pie chart does best. (Read more about chart types.)
Since Pie charts are relatively simple, Quickbase offers just a few options.
To select data for a pie chart:
To begin the steps below, you must already have accessed the report builder (by creating a report with Chart as the report type and Pie as the chart type, or by editing an existing Chart report).
Note: If you're interested in seeing only a specific subset of records, you should also set your matching criteria prior to following the steps below.
-
Within the Series section, select a field whose values you want display.
Then tell Quickbase how to group the data from that field using the Group By option: Use this dropdown to display data in intervals or set amounts. For example, if your pie chart features a numeric field, you can show amounts in groups of fives, tens or hundreds if you want.
Note: After you select the field whose values you want to appear as wedges on your chart, Quickbase displays these values in the Report Builder's Legend box, which shows you what values will eventually display. If you want to customize the colors for these values, click a color swatch to display the color chooser.
-
Select the data you want to show.
Use the Data values section to select your measure. For example, you might measure salesperson contribution by number of sales, or by dollar amounts. The field you choose here contains the numbers that determine the size of each pie wedge.
-
Use the Sorting section to decide how to sort your pie chart.
-
Once you've configured all the data options outlined above, return to the creating a chart topic and read how to finish the job.
Example:
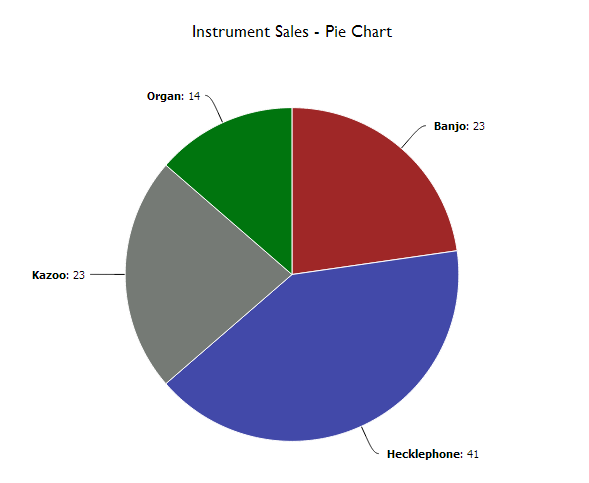
The first image below shows the setup for a pie chart. The field selected in the Series dropdown contains the values that display in the Legend. Values in the legend are those that will appear on your final chart (shown in the second image below).
|
|
|
|
Chart in the Report Builder |
Chart Displayed |